Pages

Saturday, September 20, 2014

Comparing Sunday, Monday and Thursday Night Football

Update: Oct. 2. I included a distribution chart showing games aren't more lopsided on any day.


In the early season, Thursday Night Football games aren't close. These Thursday games take abuse in the sports media empire for pitting blowouts featuring bad teams. The argument is that Thursday Night Football games (NFLN/CBS) are inferior to counterparts Sunday Night Football (NBC) and Monday Night Football (ESPN). 

I decided to test the hypothesis in two ways. The first was to find out how close the games were on each network. The second was to figure out how strong each team was. To do this, I went back to 2006, when the new sports media deals took place, and compared scoring margins of games on each network.


(SNF games also include the first week's Thursday game featuring the Super Bowl champion. TNF does not include Thanksgiving games, but the night one is in the NBC umbrella.)

NFL games roughly end in with similar point margins, regardless of network. Close are defined as ones that end in a one-score game, while I defined blowouts as games that were decided by at least three touchdowns. The myth that TNF are blowouts has been busted.

The second test was determining how good the competing teams were. I used each team's ending season win percentage to encompass the entire season. I also determined how many games featured sub-.500 teams (again, end of season record). 


First off, a disclaimer. NBC has an inherent advantage against over competitors - it utilizes flex scheduling in the second half of the season. That means the network may swap an unfavorable game for a more exciting one. A game has been replaced 12 times since 2006. Additionally, NBC gets their choice of game in Week 17, which always has playoff implications. TNF and MNF cannot swap games. The "SNF no flex" makes NBC stand with its original selection, and does not include games flexed in.

It's clear that NBC features better teams than ESPN or CBS/NFL Network, even when factoring in flex. TNF games were more than twice as likely to feature a sub-.500 team than a SNF game. In terms of total duds (two sub-.500 teams) SNF wins again.

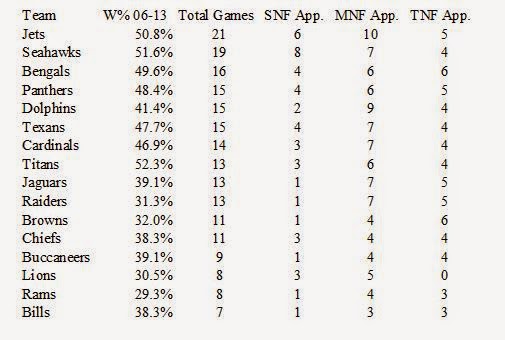
To figure out how SNF beats its competitors, I decided to look at which teams the networks are airing. Not surprisingly, "America's Team" led the way with 43 national TV selections (not including Thanksgiving) with 28 coming on NBC. 


SNF picks the popular and winning teams, while TNF and MNF give a fairer representation of the league. The Cowboys have aired on SNF as much as 13 NFL teams since 2006. MNF still favors the glamorous teams, but nowhere near the level of SNF. In a little more than half the amount of games that the other two have, TNF has a fairly even distribution.

To show how wide the distribution is, here's MNF vs. SNF:

SNF Mean: 9.06 appearances per team. Standard Deviation: 7.67
MNF Mean: 8.69 appearances per team. Standard Deviation: 3.26


Monday, September 8, 2014

Losing the first NFL game is like any other week, but 0-2 is panic time

Attention Packers, Saints, Bears, Patriots, Ravens, Colts and Cowboys fans it's not panic time yet. 

You're all 0-1. History shows us that plenty of 0-1 teams still make the postseason. Here are the numbers from the past decade. 

1-0 start: 53.75% reach postseason
0-1 start: 21.25%

It's not a surprise that 1-0 teams fare better than 0-1 counterparts given that it generally takes 10 wins to make the playoffs. Teams that go to the postseason (last five years) fared 31% better on average over the regular season than the teams that miss out. 

When we look at the first week's results, we're just singling out one piece to the puzzle. Looking at other weeks in the regular season yields similar results. I randomly picked a team's ninth game to explore. Results from past decade: 

Wins Ninth Game: 51.25% reach postseason
Loses Ninth Game: 23.42%

So the ninth game of the season means almost as much as the first game. The 2.5% difference is negligible. (There was also a tie in 2012, so the sample size is 318 teams for the ninth game). The bottom line is it hurts to lose any NFL game, regardless of the week. 

If a team begins the season on a losing streak, then it's officially time to panic. It should also be noted that it's not time to celebrate by starting the season strong. I ran the numbers from the same past decade (2004-2013), to include the second game. 

2-0 start: 61.90% reach postseason
1-1 start: 40.79%
0-2 start: 7.14%

Beyond the second week, only three teams have ever made the postseason starting 0-3, and none in the past decade. 

Those teams: Chargers in 1992, Lions in 1995, and Bills in 1998. Only those Chargers escaped from an 0-4 hole, although the Steelers (0-4 to 8-8) nearly pulled off the feat last year. And even the 2013 Steelers would have had one of the worst records to ever make the postseason. 

Tuesday, August 26, 2014

Super Bowl hangover: myth or reality

You’ve probably heard about the Super Bowl hangover. The myth is that teams playing in the big game ultimately flop the next season. There are a variety of reasons cited, the most common one being it's too expensive to hang on to players in the salary cap era. 

I decided to test the post-Super Bowl dropoff theory by using data from all the first 47 Super Bowls. We'll see how the Seattle Seahawks and Denver Broncos do this season.  

And off we go ... 

Excluding last year’s game, Super Bowl participants won at a 78.4% clip in the regular season (the champs did slightly better than the losers). The following season, those same teams averaged a 65.5% winning percentage. 

Over a 16 game schedule, the difference in percentages translates into an average of 2.06 more games won by the Super Bowl participant in the year of the run than the year after. I also found that the year preceding the Super Bowl run, teams had a 66.8% winning percentage, slightly above the year before. 

Of the 94 teams to make the Super Bowl, 29 (30.9%) did not make the playoffs the following season. Spaced out over the 16 game schedule, 34% had a winning percentage lost three more games the following season. 

There's definitely some evidence that a Super Bowl hangover occurs, but the majority of teams still have solid seasons. The median win-loss record for the teams the next season is 11-5. It's nearly impossible to sustain long-term success at this level unless a team has a Hall of Fame quarterback, like Tom Brady or Peyton Manning.

Hometown curse?
To this day, no team has won a Super Bowl in its own stadium, sparking speculation about another jinx - the hometown curse.

Teams that have hosted a Super Bowl won just 44.1% of their games in the regular season, with the median at 43.8% (7-9).

The San Francisco 49ers were the closest to win one at home, winning Super Bowl XIX at Stanford, maybe 45 minutes away from Candlestick. The Los Angeles Rams lost a Super Bowl in Pasadena, roughly half an hour away from the Coliseum. 

Most of the games have taken place in Florida (15), Southern California (10) and New Orleans (10). Florida is broken down into Miami (10), Tampa Bay (4) and Jacksonville (1). Southern California is as follows: Pasadena (5), San Diego (3) and Los Angeles (2).

Of the 51 hosts, just 16 teams were above .500 in the regular season and recorded double-digit wins nine times. Last season, 11 teams (34.3%) had double-digit wins in the regular season.

I know what you're thinking. Historically, the New Orleans Saints have stunk and their appearances are dragging down the rest of the hosts. Well, even excluding the Saints, the rest of the hosts won at a 46.8% clip. 

Note: I counted the Raiders and Rams as host teams when it was in Pasadena, when those teams were located in Los Angeles even though it wasn't their home stadium because of the close proximity between the two cities. I also counted the 49ers and Stanford's.  

Sunday, August 17, 2014

AP Preseason Poll: Historically the most overrated team is (spoiler)

The Associated Press Top 25 poll is out. For once, polls will not have a direct impact on who gets to play in the championship. Instead, a committee will meet to determine the best teams.

Now that the polls don't matter, I thought it would be fun to figure out the most overrated and underrated teams in the BCS era. I couldn't find receiving votes in the AP poll prior to 2003, so this will just focus on the last 11 seasons.

To compile the most overrated team in college football, I compared the preseason AP Top 25 poll with the final poll (after the bowls). The team with the greatest discrepancies in the polls are either overrated or underrated. To calculate this I took each team's percentage of possible votes for each preseason and postseason poll because there are differing amount of voters each year.

I've included all teams in current Power Five conferences, plus Notre Dame, BYU, Boise State, Cincinnati and Connecticut.

Let's get right to it.

If we were to conduct an AP Top 25 based on the preseason polls from the last 11 seasons, with 1600 maximum points (64 voters), it would look like this (2014 not included):

1. Oklahoma 1279
2. Ohio State 1164
3. Southern California 1150
4. LSU 1112
5. Texas 1098
6. Georgia 927
7. Florida 920
8. Virginia Tech 755
9. Florida State 747
10. Alabama 720
11. Michigan 706
12. Oregon 619
13. West Virginia 557
14. Auburn 546
15. Miami 539
16. Wisconsin 507
17. Boise State 421
18. Tennessee 376
19. Nebraska 373
20. Louisville 370
21. Clemson 370
22. TCU 360
23. California 334
24. Notre Dame 332
25. Iowa 324

Receiving Votes: Oklahoma State 320, South Carolina 313, Stanford 276, Texas A&M 273, Penn State 256, Arkansas 247, Kansas State 220, Missouri 202, Pittsburgh 181, Michigan State 143, Ole Miss 141, Arizona State 138, Georgia Tech 128, Virginia 125, Purdue 123, Texas Tech 119, Utah 97, Maryland 96, UCLA 87, BYU 86, NC State 80, Kansas 76, Washington 70, North Carolina 68, Rutgers 62, Oregon State 58, Illinois 53, Boston College 36, Wake Forest 24, Northwestern 20, Cincinnati 19, Minnesota 16, Baylor 10, Colorado 6, Connecticut 4.1, Arizona 3.6, Washington State 2.3, Vanderbilt 2.1, Iowa State 1.9, Mississippi State 0.5, Kentucky 0.1.

None of Top 10 is the least bit surprising, although I was a little at how low Oregon is. Indiana, Syracuse and Duke did not receive a single vote.

On the flip-side, if we were to conduct an AP Top 25 based on the postseason polls from the last 11 seasons, it would look like this (same scale):

1. Ohio State 1083
2. LSU 1040
3. Southern California 984
4. Oklahoma 953
5. Alabama 849
6. Texas 809
7. Oregon 757
8. Boise State 732
9. Georgia 710
10. Florida 673
11. Auburn 661
12. Virginia Tech 576
13. TCU 541
14. Florida State 493
15. Stanford 454
16. Michigan 436
17. Wisconsin 426
18. Louisville 414
19. West Virginia 410
20. Penn State 365
21. Utah 350
22. Iowa 344
23. Oklahoma State 341
24. South Carolina 338
25. Missouri 329

Receiving Votes: Clemson 305, Michigan State 300, Notre Dame 293, Miami 284, Arkansas 270, Tennessee 237, Kansas State 221, Cincinnati 216, BYU 214, Nebraska 208, Texas Tech 207, Texas A&M 205, Boston College 196, Ole Miss 182, California 173, Baylor 160, UCLA 134, Arizona State 119, Kansas 117, Oregon State 117, Georgia Tech 96, Washington State 95, Pittsburgh 87, Rutgers 84, Maryland 67, Mississippi State 58, Wake Forest 54, Northwestern 49, Purdue 48, Illinois 40, Minnesota 33, Vanderbilt 29, Virginia 24, Duke 18, NC State 13, Washington 11, Kentucky 5, Connecticut 2.7, Colorado 1.2, Arizona 1.0.

North Carolina, Iowa State, Syracuse, and Indiana did not receive a vote, with the latter two not receiving a vote in the preseason poll either. North Carolina actually received points in the preseason poll five seasons, but did not perform well enough to finish with any after the postseason. Iowa State only had 21 preseason points, so their lack of getting any after the season isn't a big dissappointment.

From these two polls, we can figure out the most overrated and underrated teams in FBS football.

Top 10 most overrated teams:
1. Oklahoma -327
2. Texas -288
3. Michigan -270
4. Miami -255
5. Florida State -254
6. Florida -248
7. Georgia -217
8. Virginia Tech -179
9. Southern California -165
10. Nebraska -165

These schools are strong brands. Half of these teams actually finished in the Top 10 in the postseason poll. Miami, Michigan, Florida State and Nebraska finished outside the Top 10, but all have historically great programs.

Top 10 most underrated teams:
1. Boise State +311
2. Utah +253
3. Cincinnati +197
4. TCU +180
5. Stanford +178
6. Boston College +160
7. Michigan State +157
8. Baylor +151
9. Oregon +137
10. Alabama +129

The top four teams from this list played in a non-major conference during at least part of the observed period. Utah and TCU currently play in big conferences, but they haven't found the same success. The main reason Cincinnati is so high on the list is because of its 2009 season, one which it entered the bowls undefeated. Stanford is the first team from this list that has spent the 11 years in a power conference.

Friday, August 15, 2014

Does the NFL preseason matter?


The NFL preseason is underway, which means football is back. It's a time full of overreactions and unnecessary panic attacks. For instance, ESPN's Ron Jaworksi said Arizona Cardinals third-string quarterback Logan Thomas played like a Pro Bowl quarterback. 

These games are important for a lot of players trying to make a team's final roster, but are they vital in determining a team's success in the ensuing regular season? A good preseason could be a sign that a team has significant roster depth. 

The most infamous overreaction occurred in 2008, when the Detroit Lions won all four of their preseason games, and ended up going winless in the regular season. 

I went back six years and found a team's preseason record and regular season record. The findings: 

Teams that won 100% of their preseason games: 39.8% regular season win percentage; 4/11 (36.4%) made postseason.
Teams that won 75% of their preseason games: 54% regular season win percentage; 22/51 (43.1%) made postseason.
Teams that won 50% of their preseason games: 54.1% regular season win percentage; 29/66 (43.9%) made postseason.
Teams that won 25% of their preseason games: 42.9% regular season win percentage; 12/39 (30.8%) made postseason.
Teams that won 0% of their preseason games: 47.5% regular season win percentage; 4/15 (26.7%) made postseason.

The numbers do show that teams that are 2-2 or 3-1 in the preseason do slightly better than their 1-3 or 0-4 counterparts, but just don't win too many games in the preseason. 

The average difference in regular and preseason win percentage is 23.1%, which would be the equivalent of roughly 3.7 regular season games. 

In addition, the correlation between preseason and regular season win percentage is just .085, although there are really only five options for a team in the preseason (excluding Hall of Fame game), while there are 17 possibilities in the regular season (excluding a rare tie). 

Here are all of the instances in graphical form, and keep in mind some data points have more than one instance represented. 

From 2008-13, comparing NFL preseason and regular season win percentage.

Friday, July 25, 2014

End of the BCS: (spoiler) would have benefited from a four or eight team playoff

Bye, Bye BCS, we hardly knew you.

The controversial bowl/playoff system was the most exclusive in American sports. Only the top two teams in the country advanced to the postseason.

In 2014, a brand new four-team playoff will debut. The altered format sparked the question: Retrospectively, who would have benefited from the new system?
In Athens, the crystal trophy is a tease seen temporarily at a Wal-Mart display.
An expanded playoff gives teams like Georgia more chances. Photo courtesy: Dean Janssen
First, I'll look at the four-team playoff and will then expand into a hypothetical eight-team one.

Four Teams

The SEC, Big 12, Pac-12 and Big Ten would have nearly equally benefited from a four-team playoff system, according to the BCS rankings released prior to bowl games. 

Below is the amount of teams ranked No. 3 and No. 4 by the final BCS standings, dating back to its inception in 1998. It's first sorted by conference and then by team.

Then Alignment/Present Alignment:
SEC: 7/7
Big 12: 7/7
Pac-12: 7/8
Big Ten: 6/7
ACC: 1/2
Big East/AAC: 2/1
MWC: 2/0

As if Alabama fans weren't spoiled enough, they were the team that would have benefited the most from a four-team playoff. The Crimson Tide finished in the top four of the BCS standings in 1999, 2008, 2009, 2011, 2012 and 2013, winning the championship under Nick Saban in 2009, 2011 and 2012.

By Team:
3: Alabama
2: Michigan, Ohio State, Oregon, Stanford, TCU, Texas, USC
1: Auburn, Cincinnati, Colorado, Florida, Georgia, Kansas State, LSU, Miami, Michigan State, Nebraska, Oklahoma, Oklahoma State, Penn State, Virginia Tech, Washington

Obviously the BCS standings aren't perfect. For example I would have been surprised if Virginia Tech (BCS No. 3) and Oklahoma (BCS No. 4) got into the postseason ahead of Georgia (BCS No. 5) in 2007.

Teams who would have had the most appearances in a four-team playoff are: Alabama (6), Ohio State (5), Oklahoma (5), Florida State (4), LSU (4), Texas (4), USC (4), Miami (3), Auburn (3) and Oregon (3).

Eight Teams

If we were to expand the playoffs to eight teams, the following conferences and teams would benefit. (This is ONLY teams ranked No. 5 - 8 in the final BCS).

Then Alignment/Present Alignment

SEC: 15/17
Big Ten: 11/12
Big 12: 14/11
Pac-12: 13/15
ACC: 3/5
MWC: 3/3
Big East/AAC: 2/1
WAC: 2/0
Independent: 1/1

By Team:
4: Florida, Georgia, Kansas State, Ohio State
3: Boise State, Oregon, Tennessee, USC, Wisconsin
2: Arkansas, Missouri, Oklahoma, Stanford, Texas, Utah, Virginia Tech
1: Arizona, Baylor, California, Florida State, Illinois, Iowa, Kansas, LSU, Louisville, Michigan, Miami, Notre Dame, Nebraska, Oregon State, Penn State, Texas Tech, Texas A&M, UCLA, Washington State

Adding six extra teams in the postseason makes Ohio State the big winner. They would have appeared in a playoff in six additional seasons beyond the national title during that time. Georgia, Florida, Kansas State, Oregon and USC would have appeared five more times.

Teams with the most total appearances in the hypothetical eight-team playoff are: Ohio State (9) USC (7), Florida (7), Oklahoma (7), Oregon (6), Alabama (6), Texas (6), Georgia (5), Florida State (5), LSU (5) and Kansas State (5).

Thursday, July 17, 2014

MLB Team Moneyball: Part III

This is Part III of a three-part series. This is the "Moneyball" section. We'll determine how efficient teams are at spending on their money.

In Part I of this series, we found that opening day salaries in major league baseball rose 85.6% from 2000 to 2013, a 37.2% real increase. In addition, 18 teams spent record amounts on their opening day roster in 2014.  

In Part II of this series, we found that spending and winning vary on a year to year, but over time, teams with high payrolls win more than teams with lower ones in the regular and postseason. 

Some management circles in major league baseball are concerned with winning, and others focus on efficiently winning. If only there was a way to do the latter-- win games without having to spend money. 

Oakland Athletics general manager Billy Beane made this concept “Moneyball” famous. His teams always ranked near the bottom of MLB in payroll (never higher than 16th in the 2000s), yet his teams kept making the playoffs. Beane couldn’t afford elite free agents in Oakland, so he utilized other approaches and exploited inefficiencies in the market to win. 

In Part III of this series, we’ll find out if the movie got it right. Were the A’s the real “Moneyball” champs of the 2000s?

The approach in Part III will be similar to Part II, where we looked at how teams finished with varying level of amounts spent. We determined there is some correlation over the long haul between spending and winning, but not as much on a year-to-year basis. This time, we'll compare how much teams spent if they did so efficiently.

This first graph plots teams into four quadrants based on the concept that if you spend more, you should win more, on an equivalent payroll and standing intervals. Most teams fall into two quadrants; either they are cheap spenders and finish better than expected, or they are heavy spenders and finish worse than expected. The team carrying the highest payroll should finish with the best record. 

The average payroll rank is plotted on the X-axis and the average MLB standing on the Y because we’re trying to determine which teams have outperformed expectations based upon salary. The line on the graph is not a “best-fit” line per se, it’s just the equation Y = X.

The farther away a team is from the Y = X line indicates how much difference the team has performed relative to expectations. Above the line: bad. Below: good. The vertical asymptope crosses at X = 15.5 because that’s the midway point on average payroll.


There are only five teams who were above-average spenders and finished better than expected or were below-average spenders and finished worse than expected. The Atlanta Braves and St. Louis Cardinals fall into the first category and the Baltimore Orioles, Houston Astros and Colorado Rockies are in the latter.

The Rockies' well-documented problem is pitching at Coors Field. The team has finished on average 24.64 in ERA from 2000-13 and 14th in the NL. The Orioles' issue is being trapped in a stacked division (the Yankees and Red Sox lead MLB in opening day payroll (2000-13)).

Twenty-one of 30 teams averaged 10-20 in the standings proves the point that teams aggregate toward the mean, despite what they spent. The best-fit linear line, which is not shown, is .467x + 8.26, showing that it's not a 1-to-1 ratio.  So the model would predict that the best possible payroll rank would be at 8.73 in the standings. At 5, 10.95. At 10, 12.93. 15, 15.26.

Here’s this graph shown from a table point of view, where we see that indeed the A's were the "Moneyball" kings of the 2000s. They finished 14.14 spots in the standings ahead of the theoretical expectation. Rounding out the top five are the Florida/Miami Marlins (+7.61), Tampa Bay Rays/Devil Rays (+6.72), the Minnesota Twins (+5.86), and the San Diego Padres (+5.39).


The common trend among the top-five teams is they all had basement payrolls. The A’s and Twins won despite the payroll, while the Marlins, Rays and Padres still finished below-average in the standings. Does finishing slightly below average with a bargain payroll constitute a success?

The five worst “Moneyball” teams according to this approach are the New York Mets (-10), the Chicago Cubs (-9.68), the Baltimore Orioles (-7.29), the Seattle Mariners (-6.17) and the Los Angeles Dodgers (-5.21). The Cubs and Mets both took on bad contracts in the 2000s, such as the four-year $66 million deal for Jason Bay or the eight-year $136 million deal with Alfonso Soriano. The Mariners haven't made the playoffs since 2001 when the team won the most games in MLB history.

This next scatter plot takes the hard numbers – salary and winning – and puts them on the same curve. The salaries are adjusted for inflation. On the X-axis is the inflation adjusted salary (2000-13) with a team’s winning percentage on the Y-axis, also from the same period. Based on the actual data, we’ve come up with a best-fitting line which is Win % = (.000000000872) * inflation-adjusted average salary + .4203. I’ve started this curve at $50 million, so don’t extrapolate and say that a team would win 42 percent of its games if it had $0 on its opening day payroll. That would be truly be Moneyball.

Here's how to read the graph: at $50 million average payroll (inflation-adjusted), a team would win roughly 46.4% of its games. At $75 million, that turns out to 48.6%. At $100 million, it’s 50.75%. At $125 million, 52.9%.


This approach gives us a different picture, although the A’s (+7.2%) are still the "Moneyball" kings and the Twins fourth (+2.6%). The St. Louis Cardinals (+5.2%) and Atlanta Braves (+4.4%) are the new two-three combo.

If you remember from the last chart, the Braves and Cardinals were the only two teams that finished with an above-average payroll rank and finished higher in the standings. The Rays (+0.3%) and Padres (0.3%) only had modest increases.

The new bottom five is as follows: Orioles (-5.0%), Kansas City Royals (-4.5%), Cubs (-4.0%), Mets (-3.4%) and Pittsburgh Pirates (-3.3%).

We've already touched on the Orioles, Cubs and Mets. The Royals and Pirates have made the playoffs once during this studied period.

Thanks for reading this series!