Pages

Thursday, December 25, 2014

College football bowls: Where coaches ranked their opponents

During bowl season, coaches will often say they are excited for the opportunity to travel to a new city and play against a good team in a finishing bowl game. Coaches won't publicly slight the city even if it's not considered a vacation destination and they wouldn't disrespect an opponent either.

However, with public Coaches' poll ballots, we can find out what a coach really thinks about their bowl opponent (though some coaches may hand their ballot to someone else in the athletic department). These ballots were completed just before bowl games and opponents were announced.

Most opposing coaches agreed with each other that one of the two teams in the bowl is superior. Only the Holiday Bowl had the coaches rank the teams in different orders and one of the coaches has been fired (Bo Pelini). As I mentioned in the blog when ballots were released, there is overwhelming evidence for familiarity bias in the polls. Coaches in the same conference rated their teams higher than coaches from other conferences for 33 of 36 teams. There were also quite a few coaches who ranked their own teams extremely high.

Anyway, here's how they voted:

Sugar Bowl:
Urban Meyer (Ohio State): Alabama 1, Ohio State 4
Nick Saban (Alabama): Alabama 1, Ohio State 4

Rose Bowl:
Jimbo Fisher (Florida State): FSU 1, Oregon 3

Cotton Bowl:
Art Briles (Baylor): Baylor 3 (extreme), Michigan State 8
Mark Dantonio (Michigan State): Baylor 5, Michigan State 7

Fiesta Bowl:
Rich Rodriguez (Arizona): Arizona 9, Boise State 17

Orange Bowl
Paul Johnson (Georgia Tech): Mississippi State 8, GT 9

Chick Fil A Peach Bowl:
Gary Patterson (TCU): TCU 3 (extreme), Ole Miss 12

Music City Bowl: Notre Dame won 31-28.
Brian Kelly (Notre Dame): LSU 23, ND NR
Les Miles (LSU): LSU 18 (extreme), ND NR

Citrus Bowl
Jerry Kill (Minnesota): Missouri 17, Minnesota 21 (extreme)
Gary Pinkel (Missouri): Missouri 13, Minnesota NR

Holiday Bowl: USC won 45-42.
Bo Pelini (Nebraska): Nebraska 20, USC 25
Steve Sarkisian (USC): USC 19 (extreme), Nebraska NR

Russell Athletic Bowl: Clemson won 40-6.
Bob Stoops (Oklahoma): Clemson 18, Oklahoma 22
Dabo Swinney (Clemson): Clemson 15, Oklahoma 25

Military Bowl: Virginia Tech won 33-17.
Frank Beamer (Virginia Tech): Cincinnati 25, VT NR
Tommy Tuberville (Cincinnati): Cincinnati 20 (extreme), VT NR

Miami Beach Bowl: Memphis won 55-48 in triple-overtime.
Justin Fuente (Memphis): Memphis 22 (extreme), BYU NR
Bronco Mendenhall (BYU): Memphis NR, BYU NR

Belk Bowl: UGA won 37-14.
Mark Richt (Georgia): UGA 12, Louisville 20

Sun Bowl: ASU won 36-31. Cutcliffe said at the press conference he thought ASU was a top-10 team and Duke top-25.
David Cutcliffe (Duke): ASU 17, Duke 22

Boca Raton Bowl: Marshall won 52-23.
Rod Carey (Northern Illinois): NIU 20 (extreme), Marshall 25

Bitcoin St. Petersburg Bowl: NC State won 34-27.
George O’Leary (UCF): UCF 21 (extreme), NC State NR

Wednesday, December 24, 2014

Final 2014 MLB payroll shows Beltway boom; D-backs & Rangers collapse

Awhile back, I conducted research on MLB opening day payrolls and the team winning that season. I found that salaries and winning in the regular season were loosely correlated, but even a mathematical correlation doesn't necessarily mean there is one (association as causation).

In the prior posts, I used opening day payroll as my X-variable. However, now that the season is over, we have the official ending payrolls of teams. I was able to find values for ending payroll from 2000-now, using three different sources. These values are used for luxury tax purposes and accounts for things like salary dumps and midseason acquisitions, along with the rest of the 40-man roster.

The expected win percent is based purely on payroll figures from 2000-14, adjusted for inflation in salaries. From the 2014 season, the Orioles (+9.8%), Nationals (+8%), Angels (+7.8%), Pirates (+7%), and Royals (+6.4%) were the top performing teams relative to their respective ending payrolls, while the Rangers (-10.2%), D-backs (-9.7%), Red Sox (-9.1%), Phillies (-8.8%) and Rockies (-7.8%) all severely underperformed. 

TeamFinal 2014 payrollWin %ExpectedDifference
Orioles$112,707,105 59.3%49.5%9.8%
Nationals$141,803,228 59.3%51.3%8.0%
Angels$164,059,717 60.5%52.7%7.8%
Pirates$78,379,602 54.3%47.3%7.0%
Royals$97,747,983 54.9%48.5%6.4%
A's$91,615,851 54.3%48.2%6.2%
Cardinals$121,003,590 55.6%50.0%5.6%
Indians$83,697,546 52.5%47.7%4.8%
Mariners$108,957,206 53.7%49.2%4.5%
Tigers$173,291,085 55.6%53.2%2.3%
Marlins$52,518,799 47.5%45.7%1.8%
Giants$165,138,449 54.3%52.7%1.6%
Brewers$110,299,643 50.6%49.3%1.3%
Mets$92,856,260 48.8%48.2%0.5%
Blue Jays$135,435,701 51.2%50.9%0.3%
Rays$77,085,054 47.5%47.3%0.3%
Padres$85,467,063 47.5%47.8%-0.3%
Dodgers$257,283,410 58.0%58.5%-0.4%
Braves$114,699,457 48.8%49.6%-0.8%
Astros$54,689,189 43.2%45.9%-2.7%
Reds$115,358,029 46.9%49.6%-2.7%
White Sox$92,472,106 45.1%48.2%-3.2%
Cubs$93,196,617 45.1%48.3%-3.2%
Yankees$218,457,904 51.9%56.1%-4.2%
Twins$91,071,286 43.2%48.1%-4.9%
Rockies$97,975,929 40.7%48.6%-7.8%
Phillies$183,456,686 45.1%53.9%-8.8%
Red Sox$168,178,367 43.8%52.9%-9.1%
D-backs$108,124,871 39.5%49.2%-9.7%
Rangers$145,707,196 41.4%51.5%-10.2%

As you'll notice in the chart below, the Orioles, Royals, and Pirates historically underachieve. So maybe there was market correction in 2014 when those three were in the top five?

To account for the change in salaries over time, I made the CPI variable which tracked movement of average salaries, which more than doubled from the observed time period (2000-14). Basically, all the prior year salaries are converted into 2014 dollars and the multiplier factor depends on the year. Just because a team spent more in 2014, it doesn't mean the team spent more relative to the rest of the league.

TeamAvg. PayrollAvg. Baseball CPIWin %ExpectedDifference
A's$60,544,004 $83,567,393 54.5%47.7%6.9%
Cardinals$98,614,830 $137,731,557 56.2%51.0%5.1%
Braves$93,834,408 $134,321,294 55.2%50.8%4.4%
Angels$110,794,460 $149,960,153 54.8%51.8%3.0%
Giants$100,745,839 $137,427,530 53.2%51.0%2.2%
Twins$68,242,531 $91,232,713 50.3%48.1%2.1%
Marlins$45,570,320 $63,841,758 48.2%46.4%1.8%
White Sox$88,480,236 $120,549,965 51.2%50.0%1.2%
Indians$68,402,902 $98,310,102 49.8%48.6%1.2%
Phillies$114,403,870 $152,476,630 52.6%51.9%0.6%
Red Sox$139,499,156 $192,832,987 55.0%54.5%0.5%
Reds$71,297,800 $96,345,542 48.7%48.5%0.3%
Rays$50,316,371 $70,050,346 46.9%46.8%0.1%
Blue Jays$81,281,310 $111,203,841 49.4%49.4%0.1%
Padres$59,493,766 $84,221,474 47.6%47.7%-0.1%
Dodgers$129,173,887 $176,603,329 53.4%53.4%-0.1%
Yankees$193,117,372 $266,992,063 58.6%59.1%-0.5%
D-backs$79,074,909 $113,736,684 49.0%49.5%-0.6%
Rangers$93,331,986 $129,456,919 49.9%50.5%-0.6%
Brewers$70,293,258 $94,151,612 47.5%48.3%-0.9%
Nationals$66,072,385 $87,443,184 46.9%47.9%-1.0%
Mariners$91,926,390 $129,143,148 49.3%50.5%-1.2%
Rockies$72,909,516 $101,887,560 46.4%48.8%-2.4%
Astros$76,821,338 $110,186,206 46.9%49.3%-2.4%
Tigers$102,008,140 $135,648,943 48.4%50.9%-2.5%
Pirates$50,339,521 $69,588,533 44.1%46.8%-2.6%
Mets$111,941,990 $158,703,919 49.3%52.3%-3.0%
Cubs$102,876,289 $142,688,975 47.5%51.3%-3.8%
Orioles$80,747,533 $113,373,868 45.6%49.5%-3.9%
Royals$58,585,331 $79,056,701 43.4%47.4%-3.9%

Going into this research, I was expecting teams to have vastly different win% expectations using ending payroll instead of beginning. However, most teams were expected to win about the same amount of games. On average the two models differed by 0.16% (about one-fourth of a win per season). 

The A's (+6.9%) are still the highest performing team relative to payroll, while the Cardinals (+5.1%), Braves (+4.4%) and Angels (+3%) round out the top four. Although in a slightly different order, the bottom five remained the same from the last model. The Royals (-3.95%), Orioles (-3.93%), Cubs (-3.8%), Mets (-3%) and Pirates (-2.6%) all have not performed relative to how much each club spent on payroll, but as I mentioned earlier, three of them shined last year. 

Saturday, December 13, 2014

USA Today/Amway Coaches' poll ballots show familiarity bias

At the end of each season, the coaches participating in the Amway/USA Today Coaches' Poll are forced to reveal their ballot. Whether or not the coaches are actually filling them out or someone else in the athletics department is doing the work is another story. Last Sunday, we saw the ballots from coaches and there were obvious signs of the familiarity bias. Coaches were generally more favorable toward their own team than their peers in addition to giving preferential treatment for conference members or out-of-conference foes.

I ran a few tests to find out who the most extreme voters were in the Coaches' poll, using the same methodology as I did last month with AP voters. Here were the top five most extreme coaches from the final ballot:

1. Rick Stockstill (Middle Tennessee): Stockstill is a prime example of someone who ranked teams higher that his team faced. Nobody has BYU (lost 27-7), Memphis (lost 36-17), or Marshall (lost 49-14) higher than he does (No. 20, No. 16 and No. 14 respectively). He gave BYU all six of its points in the poll and Memphis 10 of its 18.

2. Frank Beamer (Virginia Tech): Beamer has the most amount of "extreme" teams among those who voted in the poll. He has Ohio State No. 2 in his poll, but the Buckeyes were only No. 2 by default when VT came to town. Beamer's most extreme ranking, though, is having Duke No. 15 (VT beat Duke 17-16). The next highest vote for Duke in the poll was No. 21.

3. Bret Bielema (Arkansas): Bielema was apparently not impressed by the teams that lost in the last week of the season. Nobody has Georgia Tech (19) and Kansas State (18) lower than him and only one person has Arizona (17) lower than he put them.

4. Art Briles (Baylor): Briles is obviously upset with the Big 12 that it promoted TCU and Baylor as co-champs, even though Baylor is the #OneTrueChampion of the Big 12. Any two-team tiebreaker would be settled by head-to-head. He ended up putting the Bears No. 3 (extreme) and TCU No. 5, with Alabama sandwiched between them.  Briles' vote for Alabama at No. 4 was the lowest the Crimson Tide received.

5. George O'Leary (UCF): Well, somebody's got to believe in Central Florida. The Knights started 0-2 with losses to Penn State and Missouri, but finished a respectful 9-1. However, that one loss is to Connecticut (2-10), which is about as ugly as a loss can get. O'Leary had UCF No. 21, and the only other vote for UCF was a No. 25 one. O'Leary also has Auburn unranked, which three others do as well. 

Other notable rankings/exclusions

-Jimbo Fisher not ranking Georgia, putting Clemson No. 12. I'm just going to assume Fisher forgot about Georgia rather than deliberately leaving them off his ballot. Georgia and Clemson are both 9-3 and the Bulldogs won the head-to-head matchup, so it wouldn't make sense for there to be that much of a difference in the other direction between the schools.

-Mike Gundy ranking TCU No. 1. Mike Gundy was really pulling for the Big 12 co-champs here. The week before TCU didn't have a first-place vote, so Gundy obviously switched his vote. Only a few people have the Horned Frogs in the Top 3, and Gundy's the only person to have them in the Top 2. He also ranked Baylor No. 3 and Oregon No. 5. Outside of his bizarre Top 5, his ballot is actually fairly closely aligned with the poll.

-Ron Turner (FIU) ranking Stanford No. 19. Stanford (7-5) certainly disappointed this season, given the Cardinal's BCS bowl streak, but it could have been better (three losses by a field goal). Turner was the only person to rank Stanford in the final coaches' ballot, and he had them at No. 19. Perhaps he ranked them because of Stanford's last game, a three touchdown wallop over UCLA, but Stanford had two less points in the poll this week than the one prior.

-Apparently, we all decided Michigan State was either the No. 7 or No. 8 team in the country. Only one voter had them different (at No. 10). Of the Top 25, the Spartans had the most conformity among voters. Wisconsin and Missouri had the least.

Conference bias

I was able to produce a ranking of each team by conference fairly easily using Microsoft Excel. For the 36 non-independent teams receiving votes in the poll, 33 of them were positioned higher in the polls by their own conference (this includes coaches voting for themselves). The three teams that were viewed less favorable were Stanford (single vote outside conference), UCLA (10.84 average vs. 10.83 Pac-12) and Wisconsin. 25 of those 33 teams were viewed as most favorable by the league they play in.

List of Extreme Teams

CoachSchoolRatingExact Coaches Matches# of extremesExtreme #1#2#3#4#5#6#7
Rick StockstillMiddle Tennessee1.31044BYU (20)Memphis (16)Marshall (14)Miss. St. (11)
Frank BeamerVirginia Tech1.13547Duke (15)Miss St (14)Ohio State (24)ASU (21)Nebraska (17)Alabama (3)UCLA (20)
Bret BielemaArkansas1.05155Georgia Tech (19)Kansas State (18)Nebraska (16)Arizona (17)Louisville (14)
Art BrilesBaylor0.96516Alabama (4)Georgia Tech (17)Louisville (12)Baylor (3)Georgia (20)Auburn (NR)
George O'LearyCentral Florida0.94743UCF (21)Arizona (18)Auburn (NR)
Mike MacIntyreColorado0.93854Air Force (24)Duke (21)Louisville (NR)Auburn (NR)
Tommy TubervilleCincinnati0.93363Cincinnati (20)Georgia Tech (16)Missouri (22)
Blake AndersonArkansas State0.91143Ole Miss (25)Northern Illinois (19)Auburn (9)
Ron TurnerFlorida International0.90574Stanford (19)Wisconsin (NR)USC (21)UCLA (20)
Les MilesLSU0.85733ASU (23)Arizona (17)LSU (18)
Troy CalhounAir Force0.80951Air Force (22)
Gary PinkelMissouri0.80074Michigan State (10)Kansas State (18)Wisconsin (8)Miss. St. (11)
Norm ChowHawaii0.79174Marshall (17)Colorado State (24)Missouri (NR)Wisconsin (NR)
Jimbo FisherFlorida State0.78884Georgia (NR)Northern Illinois (22)Louisville (13)Clemson (12)
Steve SpurrierSouth Carolina0.78582Colorado State (23)Louisville (NR)
Todd MonkenSouthern Miss.0.78052Nebraska (16)Georgia (20)
Al GoldenMiami0.77150
Dan McCarneyNorth Texas0.74770
Todd BerryLousiana - Monroe0.74752Baylor (3)Florida State (5)
Rocky LongSan Diego State0.74361Utah (19)
Craig BohlWyoming0.73341Boise State (10)
Terry BowdenAkron0.73231Oklahoma (16)
Kevin WilsonIndiana0.72263Clemson (NR)ASU (9)LSU (18)
Justin FuenteMemphis0.71052Memphis (22)Auburn (NR)
Bobby HauckUNLV0.70351Colorado State (24)
Rod CareyNorthern Illinois0.70342Northern Illinois (20)Louisville (NR)
Charlie StrongTexas0.69961TCU (3)
David BailiffRice0.68861Cincinnati (23)
Bo PeliniNebraska0.671102Minnesota (19)Louisville (NR)
Brady HokeMichigan0.66230
Mike GundyOklahoma State0.65493TCU (1)Oregon (5)Baylor (3)
Chris PetersenWashington0.65483UCLA (21)Oklahoma (19)Missouri (22)
Dino BabersBowling Green0.64871Utah (21)
Urban MeyerOhio State0.635100
Matt RhuleTemple0.63370
Nick SabanAlabama0.62881LSU (18)
Steve SarkisianUSC0.60562USC (19)Utah (20)
Frank SolichOhio0.59562Minnesota (21)UCLA (20)
Mike RileyOregon State0.59341Alabama (3)
Gary PattersonTCU0.584112Oklahoma (18)TCU (3)
Bronco MendenhallBYU0.58390
Tim DeRuyterFresno State0.57531Alabama (3)
Dennis FranchioneTexas State0.57591Mississippi State (11)
Larry BlakeneyTroy0.56972Missouri (24)Minnesota (21)
Jeff QuinnBuffalo0.56790
Bill BlankenshipTulsa0.55580
Larry FedoraNorth Carolina0.54671Mississippi State (12)
Bob StoopsOklahoma0.545111TCU (3)
Dabo SwinneyClemson0.53760
Matt CampbellToledo0.51970
Larry CokerUTSA0.51970
Jerry KillMinnesota0.51961Minnesota (21)
Paul JohnsonGeorgia Tech0.51860
Brian KellyNotre Dame0.510101Alabama (3)
Mark RichtGeorgia0.49390
David CutcliffeDuke0.49160
Rich RodriguezArizona0.47590
Mark DantonioMichigan State0.475110
Mike LeachWashington State0.46980
Bob DiacoConnecticut0.45790
Ken NiumataloloNavy0.417100


(The rating is a formula I came up with to determine how extreme a voter is. The exact coaches matches means that a coach ranked the team the same as the final poll turned out. I blued extreme teams that were from the head coach of that team.)

Tuesday, November 25, 2014

AP ballots: Most extreme voters

The AP poll doesn't mean anything in the race for the college football national championship. It hasn't for about a decade. But it's still often cited in the news media (some participate in it) and by the schools themselves.

The public nature of the poll means the media's ballots are highly scrutinized. Each week, College Poll Tracker posts individual ballots. The site is also sortable by school, so one can see where everyone ranked a particular school.

Using the site's data, I'm bringing back a concept introduced by the now-defunct Pollspeak: extreme ballots. Essentially, voters rank teams higher/lower than others, and the extreme voters are even more bold with their ballot.

On a team basis, the schools with the most disagreement among voters in this week's AP top 25 (in order): Marshall, Ole Miss, Colorado State, Oklahoma and Missouri. And the least: Oregon, Alabama, Baylor, Mississippi State and Florida State.

But back to the individual voters. It's a lot more fun when a name/face is put to the vote. Here's who I found to be the top five extremists in this week's AP top 25:

1. Jon Wilner. Those that read Pollspeak last year knew Wilner was one of the more forward-thinking or crazy voters, depending on your viewpoint. In this week's poll, he's got undefeated Florida State No. 6. Vegas and analytics using margin of victory would agree with him, but no other voter has the Seminoles outside the top four. Wilner also has USC 20th, giving the Trojans six of their eight points in the poll.

2. Josh Kendall. Kendall's Top 7 is something else. He's got five extreme teams in those slots alone. (TCU 2, Ohio State 3, Alabama 4, Oregon 5 and Mississippi State 7).

3. Drew Sharp. Sharp's ballot isn't kind to the Big Ten, which is a little surprising considering he's based in Detroit. Nobody has Michigan State (19), Wisconsin (18) or Ohio State (10) lower than him.

4. Eric Hansen. Hansen has seven extreme teams, tied for the AP poll lead along with Kendall. He has a soft spot for Louisville (No. 16), which just beat Notre Dame (his beat coverage). Hansen has had them ranked higher than any other voter three weeks running.

5. Logan Lowery. Lowery's only got two extreme teams, which is a lot fewer than most. Still, he's the only person to rank Central Florida, and he had the Knights higher than anyone this preseason (No. 10). Lowery's also got ASU No. 21, three spots lower than anyone else.

Below, I've got the full list of voters. The rating I used is a measure of extremeness. The number in parentheses is where the voter ranked the team. You'd be surprised, but no two voters were exactly alike and none mimicked the end result from the AP top 25. Many people picked the same top 25, just in different orders. Nate Sandell had 17 exact matches with the AP's top 25, while two people had just one.


Voter NameRating# of Extreme TeamsExact AP MatchesMost Extreme Team#2#3#4#5#6#7
Jon Wilner1.42765USC (20)Utah (22)Florida State (6)Oklahoma (13)Arizona State (18)Miss. St. (2)
Josh Kendall1.31872West Virginia (24)Arkansas (18)Ohio State (3)TCU (2)Oregon (5)Miss. St. (7)Alabama (4)
Drew Sharp1.12762Michigan State (19)Wisconsin (18)Ohio State (10)Clemson (17)Georgia Tech (12)Florida State (4)
Eric Hansen1.05075Louisville (16)LSU (19)Missouri (23)Miss. St. (2)Wisconsin (17)Colorado St. (NR)Georgia Tech (20)
Logan Lowery0.97429Central Florida (25)Arizona State (21)
Eric Avidon0.94724Texas A&M (24)Michigan State (14)
Scott Nulph0.93542Miss. St. (7)Marshall (11)Arizona (17)Ole Miss (NR)
Chuck McGill0.87234Memphis (25)Ohio State (3)Arkansas (21)
Joey Knight0.85635Utah (23)Ohio State (4)Arkansas (22)
Adam Sparks0.85418Duke (20)
Tom Murphy0.84547LSU (19)Arkansas (20)Miss. St. (2)Colorado St. (NR)
Bob Asmussen0.83656Nebraska (23)Kansas State (16)Arizona (17)Georgia Tech (20)Ole Miss (13)
Ed Johnson0.83341Baylor (3)Utah (24)Oklahoma (14)Florida State (4)
Iliana Limon Romero0.81431Auburn (22)Georgia (13)Boise State (20)
Kyle Ringo0.80614Nebraska (22)
Scott Wolf0.792412UCLA (14)Arizona (18)Oklahoma (NR)Auburn (12)
Kirk Bohls0.77614LSU (18)
Grant Ramey0.74005None
Rob Long0.73728UCLA (13)Nebraska (24)
Chadd Cripe0.73715Georgia Tech (20)
Doug Lesmerises0.73615Oregon (1)
Mike Sorensen0.73324Boise State (20)Arkansas (22)
Kellis Robinett0.71836TCU (2)Georgia Tech (20)Colorado St. (15)
Seth Emerson0.71505None
Adam Zucker0.70907None
Steve Sipple0.70928Clemson (17)Ole Miss (NR)
Keith Sargeant0.70826Memphis (25)Ohio State (4)
Chris Murray0.69525Arizona State (6)Kansas State (15)
Sam Werner0.68415Duke (24)
Donald Heath0.67617Alabama (4)
John Silver0.67027Memphis (25)Boise State (19)
Jay Binkley0.66827Missouri (11)Georgia (6)
Brett McMurphy0.66426Boise State (20)Auburn (12)
Bill Rabinowitz0.66016Wisconsin (10)
Garry Smits0.65936Ohio State (4)Georgia Tech (20)TCU (8)
Michael Lev0.62915Missouri (24)
Tommy Deas0.62116Nebraska (24)
Ross Dellenger0.61507None
Larry Vaught0.584211USC (24)Oregon (1)
Charles Davis0.56629Wisconsin (9)Louisville (19)
Brent Axe0.56005None
Pete DiPrimio0.541113Colorado St. (15)
Jim Polzin0.540012None
Garland Gillen0.53505None
Adam Jude0.52205None
Gary Horowitz0.52207None
Daniel Berk0.51708None
Tim Griffin0.515111Boise State (19)
Doug Doughty0.508010None
Ken Medlin0.49708None
Steve Batterson0.48307None
Robert Cessna0.459011None
Nick Baumgardner0.42607None
Mike Herndon0.424011None
Nate Sandell0.422017None
Jimmy Burch0.42008None
Matt McCoy0.412012None
John Shinn0.390016None
Ferd Lewis0.386013None
Scott Hamilton0.336010None

Tuesday, October 14, 2014

What historical odds say about Orioles', Giants' chances

The Baltimore Orioles are in a tough spot. They're down 2-0 and now the series heads to Kansas City, against a team with all the momentum and seemingly destiny on their side too.

What are the chances they come back in this series?

This exact scenario, overcoming the 2-0 deficit hitting the road happened three times beginning 1985: 1985 (Royals over Cardinals), 1986 (Mets over Red Sox), 1996 (Yankees over Braves). Another spin: it's happened once since 1986. So, not likely.

I examined MLB postseason results from all seven game series', 1985-present, when the NLCS/ALCS round was changed from five games to seven, to help find out some more clues.

Here's  the chance of winning a series when leading ...

1-0: 66.7%
2-0: 85.7%; 42 series, 14 sweeps, 10 times it ends in Game 5, seven times 2-0 team closes in Game 6, five in Game 7. Twice the team down 0-2 came back to win in six, four times in seven. 
2-1: 76.7%
3-0: 94.1%; 14/17 sweeps, two went to six, Red Sox famously came back in 2004.
3-1: 82.2%: these have been hard to close out. The 3-1 leader wins Game 5 just 42.2% of the time. Typically the 3-1 leader has to close it in 6 (61.5% winning percentage in game) or else they'll lose the series in the seventh (70%).
3-2: 66.7%: The 3-2 leader finishes it off 54.9% of the time in Game 6, but rarely comes back from losing that game (26.1%).

The San Francisco Giants are in a different boat than the Orioles. The series is tied 1-1 and the Giants are coming home. In a seven game series, a tie after two is just as likely as one team winning both.

You'd think stealing home field would be an advantage, but historically it hasn't at this stage in the series. The team that lost home field advantage (1-1 series') actually won 25 of 42 times.

Anyway, the winner of Game X wins the series X percent of the time ...

1: 66.7% (see 1-0 lead)
2: 69%
3: 61.9%: In a tie series, the Game 3 winner actually moves on 73.8% of the time. This has typically been the game a 2-0 series leader drops (59.5% of the time).
4: 70.2%
5: 61.4%: In tie series, Game 5 winner moves on 64% of the time.
6: 88.2%
7: 100% (obviously) ... team at home is 17-6 in this game.

Final point: 5 or 7-game series ... The team that gets to three wins in a 7-game series first hangs on 79.8% of the time.

Monday, October 13, 2014

Latest BCS rankings: One Mississippi (State), Two Mississippi

The latest BCS ranking are just like the old counting method: One Mississippi (State), Two Mississippi. First time that's ever happened. 

I'll try to update this each week of the season. You can imagine there will be controversy if the BCS No. 4 doesn't match the selection committee's No. 4 team (the committee's first ranking comes out in two weeks). 

For Sagarin, I used Elo Score, which was the closest to his most recent ranking that he used in the BCS. He has North Dakota State ranked in this; I'm not sure if the others include FCS teams in their rankings. The Harris Poll has been replaced by the AP, which used to be used in the rankings. I got Wolfe's ratings from Massey's comparison web site. 


Wednesday, October 8, 2014

If AP poll members were on the College Football Playoff committee...

The College Football Playoff is new, and there's a lot of mystery behind its process. Instead of voters, we have committee members. The committee will have its own ranking, but it's a multistage process to get there. 

Here's how it works:

A. Each committee member selects its best 25 teams (unordered). Schools have to appear on at least three ballots to be eligible. 
B. Each committee member provides the best six teams (again unordered). The six teams on the most ballots proceed.
C. Each voter then ranks those six teams 1-6. The three teams with the lowest combined totals are ranked in order and the other three are subject to the next round.
D. Repeat B and C until 25 teams are ranked

I decided to test how this process works and used ballots from 13 AP voters. 

My sample: Adam Jude (Seattle Times), Seth Emerson (Macon Telegraph), Jon Wilner (San Jose Mercury News), Brett McMurphy (ESPN), Sam Werner (Pittsburgh Post-Gazette), Chris Murray (Reno Gazette-Journal), Daniel Berk (Arizona Daily Star), Harold Gutmann (Durham Herald-Sun), Kellis Robinett (Wichita Eagle), Steven Sipple (Lincoln Journal Star), Joey Knight (Tampa Bay Times), Josh Kendall (The State (South Carolina)), Grant Ramey (Volquest)

Here's the result from just adding up their ballots, the way polls do it.   

1. Auburn 319
2. Florida State 311
3. Mississippi State 290
4. Ole Miss 284
5. Baylor 272
6. Notre Dame 252
7. Alabama 231
8. TCU 228
9. Arizona 223
10. Oregon 208
11. Oklahoma 203
12. Michigan State 195

Note: Auburn is not first in the actual AP poll (trailing by two points). My sample just favored the Tigers (and the Wildcats) relatively more than the other AP voters. 

All 13 voters included the poll’s top four teams – Florida State, Auburn, Ole Miss and Mississippi State in the top-six, while 10 had Baylor and nine had Notre Dame. Those six schools move on because they were on the most top-six lists,

Using their Top 25s, I can tell the the preference each team has with each voter. So assigning 1-6 values to those six teams, this is how they would have voted, sticking to their ballot:

1. Auburn (19)
2. Florida State (25)
3. Mississippi State (46)
NR Ole Miss (52)
NR Baylor (58)
NR Notre Dame (73) 

Auburn, Florida State and Mississippi State are the 1-3 teams in the playoff if the season were to end this week and these AP voters were committee members. The process then repeats itself. 

In the next round, Ole Miss, Baylor, Notre Dame, Alabama, Arizona and TCU were on the most top-sixes of remaining teams. 

4. Ole Miss (21)
5. Baylor (30)
6. Notre Dame (45)
NR TCU (57)
NR Arizona (59)
NR Alabama (61)

In the third round, Alabama, TCU, Arizona, Oregon, Oklahoma and Michigan State appear on the most ballots.

7. Alabama (31)
8. TCU (36)
9. Arizona (38)
NR Oregon (51)
NR Oklahoma (58)
NR Michigan State (59)

In the last round (for this blog post), Oregon, Oklahoma, Michigan State, Georgia, Texas A&M, UCLA were on the most top-six ballots of remaining schools.  

10. Oregon (24)
11. Oklahoma (28)
12. Michigan State (36)
NR Texas A&M (52)
NR Georgia (61)
NR UCLA (72) 

In short, the Top 12 is the exact same as their AP ballots. 

1. Auburn
2. Florida State
3. Mississippi State
4. Ole Miss
5. Baylor
6. Notre Dame
7. Alabama
8. TCU
9. Arizona
10. Oregon
11. Oklahoma
12. Michigan State

It's interesting that this complex methodology reveals the exact same ranking as just a straight 1-25 poll (though I only checked the Top 12). 

There's two ways this method produces a different result. The first is when there is a close race between two teams and one team has more variability than the other (as in a ranking lower than sixth). 

Hypothetically say Auburn and Florida State are tied for third in a three-person poll. Auburn has 2 third place votes and 1 fourth place vote. Florida State has two second place votes and one seventh place vote. Adding it up, they each have 67 points (or 11 if starting the other way). In this system, Florida State's seventh place vote gets replaced with a sixth place vote and the Seminoles would prevail.

The second way is a voter having a team ranked in the top six that is not one of the six most frequent teams.  Let's say one voter's top six is Auburn, Arizona, Florida State, Ole Miss, Mississippi State and Notre Dame. Arizona is not one of the the six most frequent teams listed in voters' top six, which means every school this voter had 3-6 gains a point on Auburn. 


Tuesday, October 7, 2014

Inaugural Mock BCS Standings: Auburn top team

Just because the BCS doesn't exist anymore, that doesn't mean we can't compute the BCS standings. Thankfully, the much-maligned computer rankings are still around. Jeff Sagarin is probably the most well-known one. Anderson & Hester was released today. Here's Billingsley, the Colley MatrixMassey, and Wolfe websites (although Wolfe's aren't updated, USA Today has an updated version).

One note about Sagarin: USA Today and others are using his overall rating for the BCS (which is a weighted synthesis of three ratings). I'm using Elo Score, one of those three, which was the closest to his Pure Elo used in the BCS. Prior to Pure Elo, Elo Score and may or may not have been included in his BCS standings under the name Elo Chess. I haven't seen Elo Chess or Pure Elo posted this year.

The BCS used the Harris and Coaches Poll and computers to determine the BCS standings. Each was worth one-third. A team's best and worst computer rankings were dropped. The Harris Poll isn't around, so I'm subbing in the AP poll as its replacement (which used to be a part of the BCS).


Wednesday, October 1, 2014

Is the Wild Card round fair? Game 1 LDS winner least likely to move on

MLB's do-or-die Wild Card round is exciting television drama. But is it fair for the participants? After all, teams play 162 games a season, plus spring training, and then the season comes down to one game.

I decided to look at the history behind the Division Series round to see if teams actually come back from 1-0 deficits.  If teams frequently mount comebacks, then there's evidence in favor of lengthening the Wild Card round. Here are the stats for the LDS round, which was reinstated following the 1994 player strike:

Up 1-0: 71.1% of teams win series
Up 2-0: 88.8%
Up 2-1: 75.5%

Winner of Game X moves on Y% of the time

1: (see 1-0 lead)
2: 75% ... Teams that won Game 1 win 59.2% of Game 2s.
3: 73.7% ... In 1-1 series, the Game 3 winner moves on 77.4% of the time.
4: 77.6% ... Team with 2-1 lead finishes the series 53.1% of the time in Game 4.
5: 100% (obviously) ... Teams that trailed 2-1 in series and forced a deciding game Game 5 win 52.2% of the time... Teams have forced 8 Game 5s after trailing 2-0 in the series, winning 5 of them.

What's interesting is the Game 1 winner is the least likely of any game in the series to decide the overall winner, though it's still a heavy favorite.

Just for kicks and giggles, I included each team's overall series record in the LDS round (post-strike).

Angels: 3-3
A's: 1-6
Astros: 2-4
Blue Jays: 0-0
Braves: 6-7
Brewers: 1-1
Cardinals: 9-2
Cubs: 1-3
D-backs: 2-3
Dodgers: 3-4
Giants: 3-3
Indians: 4-2
Mariners: 3-1
Marlins: 2-0
Mets: 3-0
Nationals: 0-1
Orioles: 2-1
Padres: 1-3
Phillies: 3-2
Pirates: 0-1
Rangers: 2-4
Rays: 1-3
Red Sox: 6-4
Reds: 1-2
Rockies: 1-2
Royals: 0-0
Tigers: 4-0
Twins: 1-5
White Sox: 1-2
Yankees: 10-7


Monday, September 29, 2014

2014 MLB Payroll Update: Revenge from Historic Underdogs

Over the summer I wrote a three-part post evaluating whether MLB teams get bang for their buck when spending on players. The theory is teams shelling out more on the payroll (opening day), win more in the regular season. But this is not always the case. The most common market inefficiency is when a young player plays well on a pre-arbitration or arbitration contract (six service years until free agency). Once a name player reaches free agency, his contract will be for more than he's providing value to the team.

Anyway, in addition to updating the data with 2014 results, I changed how the adjusted payroll was calculated. Instead of using general economic inflation, I adjusted each season's average payroll to equal the same amount (about $115 million). This merges the two team graphs from last time into one. It both provides a peer group comparison and factors in rising player costs.

For example, the New York Yankees' $206 million spent in 2005 (league average was $73 million) turns into $325 million in 2014 dollars because of how much more money the league spends on payroll now. I started the baseball CPI in 2000 at base 100 and in 2014, it has ballooned to 207 (meaning salaries have more than doubled in this time span).

Without further adieu, here's the updated graph...


2014 was a season of revenge for the traditional underdogs. The Pirates and Royals are in the postseason together for the first time in MLB history. For the Royals, it's the team's first playoff appearance since 1985. For the Pirates, it's only the second occurrence since 1992 (and both happened in the past two seasons). 

The new model didn't change the results as much as I thought it would. Teams are now just further to the right on the X-axis, but the best-fit curve moved with it. Adding 2014 slightly moved MLB teams closer to the mean (there's a higher R-square and correlation than last year). 

The top five most improved teams by adding 2014 (in order) were the Orioles, Royals, Pirates, Nationals/Expos and Mariners. And the biggest drop-offs (in order) Phillies, Rangers, Red Sox, D-backs and the Twins. The Rangers and D-backs went from above the line in 2013 to below when including 2014. 

Once again, the A's are the "Moneyball" winner, but the enormous lead over the Cardinals shrunk. The Angels had the best record in MLB this year, and passed the Twins. Despite, the Orioles, Royals, and Pirates' improvements in 2014, they still need a few more good seasons to get back to league average. The expected win percentage is based on the baseball CPI figure from the right (it's also shown in the graph). There are 15 seasons documented. 


Saturday, September 20, 2014

Comparing Sunday, Monday and Thursday Night Football

Update: Oct. 2. I included a distribution chart showing games aren't more lopsided on any day.


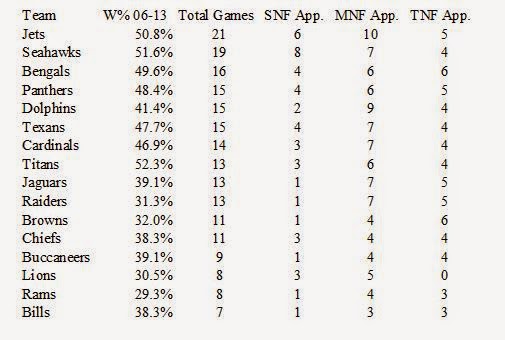
In the early season, Thursday Night Football games aren't close. These Thursday games take abuse in the sports media empire for pitting blowouts featuring bad teams. The argument is that Thursday Night Football games (NFLN/CBS) are inferior to counterparts Sunday Night Football (NBC) and Monday Night Football (ESPN). 

I decided to test the hypothesis in two ways. The first was to find out how close the games were on each network. The second was to figure out how strong each team was. To do this, I went back to 2006, when the new sports media deals took place, and compared scoring margins of games on each network.


(SNF games also include the first week's Thursday game featuring the Super Bowl champion. TNF does not include Thanksgiving games, but the night one is in the NBC umbrella.)

NFL games roughly end in with similar point margins, regardless of network. Close are defined as ones that end in a one-score game, while I defined blowouts as games that were decided by at least three touchdowns. The myth that TNF are blowouts has been busted.

The second test was determining how good the competing teams were. I used each team's ending season win percentage to encompass the entire season. I also determined how many games featured sub-.500 teams (again, end of season record). 


First off, a disclaimer. NBC has an inherent advantage against over competitors - it utilizes flex scheduling in the second half of the season. That means the network may swap an unfavorable game for a more exciting one. A game has been replaced 12 times since 2006. Additionally, NBC gets their choice of game in Week 17, which always has playoff implications. TNF and MNF cannot swap games. The "SNF no flex" makes NBC stand with its original selection, and does not include games flexed in.

It's clear that NBC features better teams than ESPN or CBS/NFL Network, even when factoring in flex. TNF games were more than twice as likely to feature a sub-.500 team than a SNF game. In terms of total duds (two sub-.500 teams) SNF wins again.

To figure out how SNF beats its competitors, I decided to look at which teams the networks are airing. Not surprisingly, "America's Team" led the way with 43 national TV selections (not including Thanksgiving) with 28 coming on NBC. 


SNF picks the popular and winning teams, while TNF and MNF give a fairer representation of the league. The Cowboys have aired on SNF as much as 13 NFL teams since 2006. MNF still favors the glamorous teams, but nowhere near the level of SNF. In a little more than half the amount of games that the other two have, TNF has a fairly even distribution.

To show how wide the distribution is, here's MNF vs. SNF:

SNF Mean: 9.06 appearances per team. Standard Deviation: 7.67
MNF Mean: 8.69 appearances per team. Standard Deviation: 3.26


Monday, September 8, 2014

Losing the first NFL game is like any other week, but 0-2 is panic time

Attention Packers, Saints, Bears, Patriots, Ravens, Colts and Cowboys fans it's not panic time yet. 

You're all 0-1. History shows us that plenty of 0-1 teams still make the postseason. Here are the numbers from the past decade. 

1-0 start: 53.75% reach postseason
0-1 start: 21.25%

It's not a surprise that 1-0 teams fare better than 0-1 counterparts given that it generally takes 10 wins to make the playoffs. Teams that go to the postseason (last five years) fared 31% better on average over the regular season than the teams that miss out. 

When we look at the first week's results, we're just singling out one piece to the puzzle. Looking at other weeks in the regular season yields similar results. I randomly picked a team's ninth game to explore. Results from past decade: 

Wins Ninth Game: 51.25% reach postseason
Loses Ninth Game: 23.42%

So the ninth game of the season means almost as much as the first game. The 2.5% difference is negligible. (There was also a tie in 2012, so the sample size is 318 teams for the ninth game). The bottom line is it hurts to lose any NFL game, regardless of the week. 

If a team begins the season on a losing streak, then it's officially time to panic. It should also be noted that it's not time to celebrate by starting the season strong. I ran the numbers from the same past decade (2004-2013), to include the second game. 

2-0 start: 61.90% reach postseason
1-1 start: 40.79%
0-2 start: 7.14%

Beyond the second week, only three teams have ever made the postseason starting 0-3, and none in the past decade. 

Those teams: Chargers in 1992, Lions in 1995, and Bills in 1998. Only those Chargers escaped from an 0-4 hole, although the Steelers (0-4 to 8-8) nearly pulled off the feat last year. And even the 2013 Steelers would have had one of the worst records to ever make the postseason. 

Tuesday, August 26, 2014

Super Bowl hangover: myth or reality

You’ve probably heard about the Super Bowl hangover. The myth is that teams playing in the big game ultimately flop the next season. There are a variety of reasons cited, the most common one being it's too expensive to hang on to players in the salary cap era. 

I decided to test the post-Super Bowl dropoff theory by using data from all the first 47 Super Bowls. We'll see how the Seattle Seahawks and Denver Broncos do this season.  

And off we go ... 

Excluding last year’s game, Super Bowl participants won at a 78.4% clip in the regular season (the champs did slightly better than the losers). The following season, those same teams averaged a 65.5% winning percentage. 

Over a 16 game schedule, the difference in percentages translates into an average of 2.06 more games won by the Super Bowl participant in the year of the run than the year after. I also found that the year preceding the Super Bowl run, teams had a 66.8% winning percentage, slightly above the year before. 

Of the 94 teams to make the Super Bowl, 29 (30.9%) did not make the playoffs the following season. Spaced out over the 16 game schedule, 34% had a winning percentage lost three more games the following season. 

There's definitely some evidence that a Super Bowl hangover occurs, but the majority of teams still have solid seasons. The median win-loss record for the teams the next season is 11-5. It's nearly impossible to sustain long-term success at this level unless a team has a Hall of Fame quarterback, like Tom Brady or Peyton Manning.

Hometown curse?
To this day, no team has won a Super Bowl in its own stadium, sparking speculation about another jinx - the hometown curse.

Teams that have hosted a Super Bowl won just 44.1% of their games in the regular season, with the median at 43.8% (7-9).

The San Francisco 49ers were the closest to win one at home, winning Super Bowl XIX at Stanford, maybe 45 minutes away from Candlestick. The Los Angeles Rams lost a Super Bowl in Pasadena, roughly half an hour away from the Coliseum. 

Most of the games have taken place in Florida (15), Southern California (10) and New Orleans (10). Florida is broken down into Miami (10), Tampa Bay (4) and Jacksonville (1). Southern California is as follows: Pasadena (5), San Diego (3) and Los Angeles (2).

Of the 51 hosts, just 16 teams were above .500 in the regular season and recorded double-digit wins nine times. Last season, 11 teams (34.3%) had double-digit wins in the regular season.

I know what you're thinking. Historically, the New Orleans Saints have stunk and their appearances are dragging down the rest of the hosts. Well, even excluding the Saints, the rest of the hosts won at a 46.8% clip. 

Note: I counted the Raiders and Rams as host teams when it was in Pasadena, when those teams were located in Los Angeles even though it wasn't their home stadium because of the close proximity between the two cities. I also counted the 49ers and Stanford's.  

Sunday, August 17, 2014

AP Preseason Poll: Historically the most overrated team is (spoiler)

The Associated Press Top 25 poll is out. For once, polls will not have a direct impact on who gets to play in the championship. Instead, a committee will meet to determine the best teams.

Now that the polls don't matter, I thought it would be fun to figure out the most overrated and underrated teams in the BCS era. I couldn't find receiving votes in the AP poll prior to 2003, so this will just focus on the last 11 seasons.

To compile the most overrated team in college football, I compared the preseason AP Top 25 poll with the final poll (after the bowls). The team with the greatest discrepancies in the polls are either overrated or underrated. To calculate this I took each team's percentage of possible votes for each preseason and postseason poll because there are differing amount of voters each year.

I've included all teams in current Power Five conferences, plus Notre Dame, BYU, Boise State, Cincinnati and Connecticut.

Let's get right to it.

If we were to conduct an AP Top 25 based on the preseason polls from the last 11 seasons, with 1600 maximum points (64 voters), it would look like this (2014 not included):

1. Oklahoma 1279
2. Ohio State 1164
3. Southern California 1150
4. LSU 1112
5. Texas 1098
6. Georgia 927
7. Florida 920
8. Virginia Tech 755
9. Florida State 747
10. Alabama 720
11. Michigan 706
12. Oregon 619
13. West Virginia 557
14. Auburn 546
15. Miami 539
16. Wisconsin 507
17. Boise State 421
18. Tennessee 376
19. Nebraska 373
20. Louisville 370
21. Clemson 370
22. TCU 360
23. California 334
24. Notre Dame 332
25. Iowa 324

Receiving Votes: Oklahoma State 320, South Carolina 313, Stanford 276, Texas A&M 273, Penn State 256, Arkansas 247, Kansas State 220, Missouri 202, Pittsburgh 181, Michigan State 143, Ole Miss 141, Arizona State 138, Georgia Tech 128, Virginia 125, Purdue 123, Texas Tech 119, Utah 97, Maryland 96, UCLA 87, BYU 86, NC State 80, Kansas 76, Washington 70, North Carolina 68, Rutgers 62, Oregon State 58, Illinois 53, Boston College 36, Wake Forest 24, Northwestern 20, Cincinnati 19, Minnesota 16, Baylor 10, Colorado 6, Connecticut 4.1, Arizona 3.6, Washington State 2.3, Vanderbilt 2.1, Iowa State 1.9, Mississippi State 0.5, Kentucky 0.1.

None of Top 10 is the least bit surprising, although I was a little at how low Oregon is. Indiana, Syracuse and Duke did not receive a single vote.

On the flip-side, if we were to conduct an AP Top 25 based on the postseason polls from the last 11 seasons, it would look like this (same scale):

1. Ohio State 1083
2. LSU 1040
3. Southern California 984
4. Oklahoma 953
5. Alabama 849
6. Texas 809
7. Oregon 757
8. Boise State 732
9. Georgia 710
10. Florida 673
11. Auburn 661
12. Virginia Tech 576
13. TCU 541
14. Florida State 493
15. Stanford 454
16. Michigan 436
17. Wisconsin 426
18. Louisville 414
19. West Virginia 410
20. Penn State 365
21. Utah 350
22. Iowa 344
23. Oklahoma State 341
24. South Carolina 338
25. Missouri 329

Receiving Votes: Clemson 305, Michigan State 300, Notre Dame 293, Miami 284, Arkansas 270, Tennessee 237, Kansas State 221, Cincinnati 216, BYU 214, Nebraska 208, Texas Tech 207, Texas A&M 205, Boston College 196, Ole Miss 182, California 173, Baylor 160, UCLA 134, Arizona State 119, Kansas 117, Oregon State 117, Georgia Tech 96, Washington State 95, Pittsburgh 87, Rutgers 84, Maryland 67, Mississippi State 58, Wake Forest 54, Northwestern 49, Purdue 48, Illinois 40, Minnesota 33, Vanderbilt 29, Virginia 24, Duke 18, NC State 13, Washington 11, Kentucky 5, Connecticut 2.7, Colorado 1.2, Arizona 1.0.

North Carolina, Iowa State, Syracuse, and Indiana did not receive a vote, with the latter two not receiving a vote in the preseason poll either. North Carolina actually received points in the preseason poll five seasons, but did not perform well enough to finish with any after the postseason. Iowa State only had 21 preseason points, so their lack of getting any after the season isn't a big dissappointment.

From these two polls, we can figure out the most overrated and underrated teams in FBS football.

Top 10 most overrated teams:
1. Oklahoma -327
2. Texas -288
3. Michigan -270
4. Miami -255
5. Florida State -254
6. Florida -248
7. Georgia -217
8. Virginia Tech -179
9. Southern California -165
10. Nebraska -165

These schools are strong brands. Half of these teams actually finished in the Top 10 in the postseason poll. Miami, Michigan, Florida State and Nebraska finished outside the Top 10, but all have historically great programs.

Top 10 most underrated teams:
1. Boise State +311
2. Utah +253
3. Cincinnati +197
4. TCU +180
5. Stanford +178
6. Boston College +160
7. Michigan State +157
8. Baylor +151
9. Oregon +137
10. Alabama +129

The top four teams from this list played in a non-major conference during at least part of the observed period. Utah and TCU currently play in big conferences, but they haven't found the same success. The main reason Cincinnati is so high on the list is because of its 2009 season, one which it entered the bowls undefeated. Stanford is the first team from this list that has spent the 11 years in a power conference.

Friday, August 15, 2014

Does the NFL preseason matter?


The NFL preseason is underway, which means football is back. It's a time full of overreactions and unnecessary panic attacks. For instance, ESPN's Ron Jaworksi said Arizona Cardinals third-string quarterback Logan Thomas played like a Pro Bowl quarterback

These games are important for a lot of players trying to make a team's final roster, but are they vital in determining a team's success in the ensuing regular season? A good preseason could be a sign that a team has significant roster depth. 

The most infamous overreaction occurred in 2008, when the Detroit Lions won all four of their preseason games, and ended up going winless in the regular season. 

I went back six years and found a team's preseason record and regular season record. The findings: 

Teams that won 100% of their preseason games: 39.8% regular season win percentage; 4/11 (36.4%) made postseason.
Teams that won 75% of their preseason games: 54% regular season win percentage; 22/51 (43.1%) made postseason.
Teams that won 50% of their preseason games: 54.1% regular season win percentage; 29/66 (43.9%) made postseason.
Teams that won 25% of their preseason games: 42.9% regular season win percentage; 12/39 (30.8%) made postseason.
Teams that won 0% of their preseason games: 47.5% regular season win percentage; 4/15 (26.7%) made postseason.

The numbers do show that teams that are 2-2 or 3-1 in the preseason do slightly better than their 1-3 or 0-4 counterparts, but just don't win too many games in the preseason. 

The average difference in regular and preseason win percentage is 23.1%, which would be the equivalent of roughly 3.7 regular season games. 

In addition, the correlation between preseason and regular season win percentage is just .085, although there are really only five options for a team in the preseason (excluding Hall of Fame game), while there are 17 possibilities in the regular season (excluding a rare tie). 

Here are all of the instances in graphical form, and keep in mind some data points have more than one instance represented. 

From 2008-13, comparing NFL preseason and regular season win percentage.

Friday, July 25, 2014

End of the BCS: (spoiler) would have benefited from a four or eight team playoff

Bye, Bye BCS, we hardly knew you.

The controversial bowl/playoff system was the most exclusive in American sports. Only the top two teams in the country advanced to the postseason.

In 2014, a brand new four-team playoff will debut. The altered format sparked the question: Retrospectively, who would have benefited from the new system?
In Athens, the crystal trophy is a tease seen temporarily at a Wal-Mart display.
An expanded playoff gives teams like Georgia more chances. Photo courtesy: Dean Janssen
First, I'll look at the four-team playoff and will then expand into a hypothetical eight-team one.

Four Teams

The SEC, Big 12, Pac-12 and Big Ten would have nearly equally benefited from a four-team playoff system, according to the BCS rankings released prior to bowl games. 

Below is the amount of teams ranked No. 3 and No. 4 by the final BCS standings, dating back to its inception in 1998. It's first sorted by conference and then by team.

Then Alignment/Present Alignment:
SEC: 7/7
Big 12: 7/7
Pac-12: 7/8
Big Ten: 6/7
ACC: 1/2
Big East/AAC: 2/1
MWC: 2/0

As if Alabama fans weren't spoiled enough, they were the team that would have benefited the most from a four-team playoff. The Crimson Tide finished in the top four of the BCS standings in 1999, 2008, 2009, 2011, 2012 and 2013, winning the championship under Nick Saban in 2009, 2011 and 2012.

By Team:
3: Alabama
2: Michigan, Ohio State, Oregon, Stanford, TCU, Texas, USC
1: Auburn, Cincinnati, Colorado, Florida, Georgia, Kansas State, LSU, Miami, Michigan State, Nebraska, Oklahoma, Oklahoma State, Penn State, Virginia Tech, Washington

Obviously the BCS standings aren't perfect. For example I would have been surprised if Virginia Tech (BCS No. 3) and Oklahoma (BCS No. 4) got into the postseason ahead of Georgia (BCS No. 5) in 2007.

Teams who would have had the most appearances in a four-team playoff are: Alabama (6), Ohio State (5), Oklahoma (5), Florida State (4), LSU (4), Texas (4), USC (4), Miami (3), Auburn (3) and Oregon (3).

Eight Teams

If we were to expand the playoffs to eight teams, the following conferences and teams would benefit. (This is ONLY teams ranked No. 5 - 8 in the final BCS).

Then Alignment/Present Alignment

SEC: 15/17
Big Ten: 11/12
Big 12: 14/11
Pac-12: 13/15
ACC: 3/5
MWC: 3/3
Big East/AAC: 2/1
WAC: 2/0
Independent: 1/1

By Team:
4: Florida, Georgia, Kansas State, Ohio State
3: Boise State, Oregon, Tennessee, USC, Wisconsin
2: Arkansas, Missouri, Oklahoma, Stanford, Texas, Utah, Virginia Tech
1: Arizona, Baylor, California, Florida State, Illinois, Iowa, Kansas, LSU, Louisville, Michigan, Miami, Notre Dame, Nebraska, Oregon State, Penn State, Texas Tech, Texas A&M, UCLA, Washington State

Adding six extra teams in the postseason makes Ohio State the big winner. They would have appeared in a playoff in six additional seasons beyond the national title during that time. Georgia, Florida, Kansas State, Oregon and USC would have appeared five more times.

Teams with the most total appearances in the hypothetical eight-team playoff are: Ohio State (9) USC (7), Florida (7), Oklahoma (7), Oregon (6), Alabama (6), Texas (6), Georgia (5), Florida State (5), LSU (5) and Kansas State (5).

Thursday, July 17, 2014

MLB Team Moneyball: Part III

This is Part III of a three-part series. This is the "Moneyball" section. We'll determine how efficient teams are at spending on their money.

In Part I of this series, we found that opening day salaries in major league baseball rose 85.6% from 2000 to 2013, a 37.2% real increase. In addition, 18 teams spent record amounts on their opening day roster in 2014.  

In Part II of this series, we found that spending and winning vary on a year to year, but over time, teams with high payrolls win more than teams with lower ones in the regular and postseason. 

Some management circles in major league baseball are concerned with winning, and others focus on efficiently winning. If only there was a way to do the latter-- win games without having to spend money. 

Oakland Athletics general manager Billy Beane made this concept “Moneyball” famous. His teams always ranked near the bottom of MLB in payroll (never higher than 16th in the 2000s), yet his teams kept making the playoffs. Beane couldn’t afford elite free agents in Oakland, so he utilized other approaches and exploited inefficiencies in the market to win. 

In Part III of this series, we’ll find out if the movie got it right. Were the A’s the real “Moneyball” champs of the 2000s?

The approach in Part III will be similar to Part II, where we looked at how teams finished with varying level of amounts spent. We determined there is some correlation over the long haul between spending and winning, but not as much on a year-to-year basis. This time, we'll compare how much teams spent if they did so efficiently.

This first graph plots teams into four quadrants based on the concept that if you spend more, you should win more, on an equivalent payroll and standing intervals. Most teams fall into two quadrants; either they are cheap spenders and finish better than expected, or they are heavy spenders and finish worse than expected. The team carrying the highest payroll should finish with the best record. 

The average payroll rank is plotted on the X-axis and the average MLB standing on the Y because we’re trying to determine which teams have outperformed expectations based upon salary. The line on the graph is not a “best-fit” line per se, it’s just the equation Y = X.

The farther away a team is from the Y = X line indicates how much difference the team has performed relative to expectations. Above the line: bad. Below: good. The vertical asymptope crosses at X = 15.5 because that’s the midway point on average payroll.


There are only five teams who were above-average spenders and finished better than expected or were below-average spenders and finished worse than expected. The Atlanta Braves and St. Louis Cardinals fall into the first category and the Baltimore Orioles, Houston Astros and Colorado Rockies are in the latter.

The Rockies' well-documented problem is pitching at Coors Field. The team has finished on average 24.64 in ERA from 2000-13 and 14th in the NL. The Orioles' issue is being trapped in a stacked division (the Yankees and Red Sox lead MLB in opening day payroll (2000-13)).

Twenty-one of 30 teams averaged 10-20 in the standings proves the point that teams aggregate toward the mean, despite what they spent. The best-fit linear line, which is not shown, is .467x + 8.26, showing that it's not a 1-to-1 ratio.  So the model would predict that the best possible payroll rank would be at 8.73 in the standings. At 5, 10.95. At 10, 12.93. 15, 15.26.

Here’s this graph shown from a table point of view, where we see that indeed the A's were the "Moneyball" kings of the 2000s. They finished 14.14 spots in the standings ahead of the theoretical expectation. Rounding out the top five are the Florida/Miami Marlins (+7.61), Tampa Bay Rays/Devil Rays (+6.72), the Minnesota Twins (+5.86), and the San Diego Padres (+5.39).


The common trend among the top-five teams is they all had basement payrolls. The A’s and Twins won despite the payroll, while the Marlins, Rays and Padres still finished below-average in the standings. Does finishing slightly below average with a bargain payroll constitute a success?

The five worst “Moneyball” teams according to this approach are the New York Mets (-10), the Chicago Cubs (-9.68), the Baltimore Orioles (-7.29), the Seattle Mariners (-6.17) and the Los Angeles Dodgers (-5.21). The Cubs and Mets both took on bad contracts in the 2000s, such as the four-year $66 million deal for Jason Bay or the eight-year $136 million deal with Alfonso Soriano. The Mariners haven't made the playoffs since 2001 when the team won the most games in MLB history.

This next scatter plot takes the hard numbers – salary and winning – and puts them on the same curve. The salaries are adjusted for inflation. On the X-axis is the inflation adjusted salary (2000-13) with a team’s winning percentage on the Y-axis, also from the same period. Based on the actual data, we’ve come up with a best-fitting line which is Win % = (.000000000872) * inflation-adjusted average salary + .4203. I’ve started this curve at $50 million, so don’t extrapolate and say that a team would win 42 percent of its games if it had $0 on its opening day payroll. That would be truly be Moneyball.

Here's how to read the graph: at $50 million average payroll (inflation-adjusted), a team would win roughly 46.4% of its games. At $75 million, that turns out to 48.6%. At $100 million, it’s 50.75%. At $125 million, 52.9%.


This approach gives us a different picture, although the A’s (+7.2%) are still the "Moneyball" kings and the Twins fourth (+2.6%). The St. Louis Cardinals (+5.2%) and Atlanta Braves (+4.4%) are the new two-three combo.

If you remember from the last chart, the Braves and Cardinals were the only two teams that finished with an above-average payroll rank and finished higher in the standings. The Rays (+0.3%) and Padres (0.3%) only had modest increases.

The new bottom five is as follows: Orioles (-5.0%), Kansas City Royals (-4.5%), Cubs (-4.0%), Mets (-3.4%) and Pittsburgh Pirates (-3.3%).

We've already touched on the Orioles, Cubs and Mets. The Royals and Pirates have made the playoffs once during this studied period.

Thanks for reading this series!