Update: Oct. 2. I included a distribution chart showing games aren't more lopsided on any day.

In the early season, Thursday Night Football games aren't close. These Thursday games take abuse in the sports media empire for pitting blowouts featuring bad teams. The argument is that Thursday Night Football games (NFLN/CBS) are inferior to counterparts Sunday Night Football (NBC) and Monday Night Football (ESPN).
In the early season, Thursday Night Football games aren't close. These Thursday games take abuse in the sports media empire for pitting blowouts featuring bad teams. The argument is that Thursday Night Football games (NFLN/CBS) are inferior to counterparts Sunday Night Football (NBC) and Monday Night Football (ESPN).
I decided to test the hypothesis in two ways. The first was to find out how close the games were on each network. The second was to figure out how strong each team was. To do this, I went back to 2006, when the new sports media deals took place, and compared scoring margins of games on each network.

(SNF games also include the first week's Thursday game featuring the Super Bowl champion. TNF does not include Thanksgiving games, but the night one is in the NBC umbrella.)
NFL games roughly end in with similar point margins, regardless of network. Close are defined as ones that end in a one-score game, while I defined blowouts as games that were decided by at least three touchdowns. The myth that TNF are blowouts has been busted.
The second test was determining how good the competing teams were. I used each team's ending season win percentage to encompass the entire season. I also determined how many games featured sub-.500 teams (again, end of season record).

First off, a disclaimer. NBC has an inherent advantage against over competitors - it utilizes flex scheduling in the second half of the season. That means the network may swap an unfavorable game for a more exciting one. A game has been replaced 12 times since 2006. Additionally, NBC gets their choice of game in Week 17, which always has playoff implications. TNF and MNF cannot swap games. The "SNF no flex" makes NBC stand with its original selection, and does not include games flexed in.
It's clear that NBC features better teams than ESPN or CBS/NFL Network, even when factoring in flex. TNF games were more than twice as likely to feature a sub-.500 team than a SNF game. In terms of total duds (two sub-.500 teams) SNF wins again.
It's clear that NBC features better teams than ESPN or CBS/NFL Network, even when factoring in flex. TNF games were more than twice as likely to feature a sub-.500 team than a SNF game. In terms of total duds (two sub-.500 teams) SNF wins again.
To figure out how SNF beats its competitors, I decided to look at which teams the networks are airing. Not surprisingly, "America's Team" led the way with 43 national TV selections (not including Thanksgiving) with 28 coming on NBC.

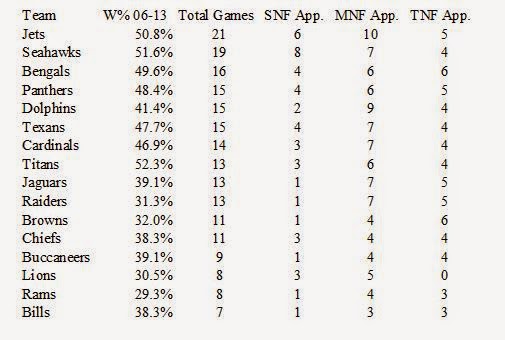
SNF picks the popular and winning teams, while TNF and MNF give a fairer representation of the league. The Cowboys have aired on SNF as much as 13 NFL teams since 2006. MNF still favors the glamorous teams, but nowhere near the level of SNF. In a little more than half the amount of games that the other two have, TNF has a fairly even distribution.
To show how wide the distribution is, here's MNF vs. SNF:
SNF Mean: 9.06 appearances per team. Standard Deviation: 7.67
MNF Mean: 8.69 appearances per team. Standard Deviation: 3.26
No comments:
Post a Comment