Pages

Monday, September 29, 2014

2014 MLB Payroll Update: Revenge from Historic Underdogs

Over the summer I wrote a three-part post evaluating whether MLB teams get bang for their buck when spending on players. The theory is teams shelling out more on the payroll (opening day), win more in the regular season. But this is not always the case. The most common market inefficiency is when a young player plays well on a pre-arbitration or arbitration contract (six service years until free agency). Once a name player reaches free agency, his contract will be for more than he's providing value to the team.

Anyway, in addition to updating the data with 2014 results, I changed how the adjusted payroll was calculated. Instead of using general economic inflation, I adjusted each season's average payroll to equal the same amount (about $115 million). This merges the two team graphs from last time into one. It both provides a peer group comparison and factors in rising player costs.

For example, the New York Yankees' $206 million spent in 2005 (league average was $73 million) turns into $325 million in 2014 dollars because of how much more money the league spends on payroll now. I started the baseball CPI in 2000 at base 100 and in 2014, it has ballooned to 207 (meaning salaries have more than doubled in this time span).

Without further adieu, here's the updated graph...


2014 was a season of revenge for the traditional underdogs. The Pirates and Royals are in the postseason together for the first time in MLB history. For the Royals, it's the team's first playoff appearance since 1985. For the Pirates, it's only the second occurrence since 1992 (and both happened in the past two seasons). 

The new model didn't change the results as much as I thought it would. Teams are now just further to the right on the X-axis, but the best-fit curve moved with it. Adding 2014 slightly moved MLB teams closer to the mean (there's a higher R-square and correlation than last year). 

The top five most improved teams by adding 2014 (in order) were the Orioles, Royals, Pirates, Nationals/Expos and Mariners. And the biggest drop-offs (in order) Phillies, Rangers, Red Sox, D-backs and the Twins. The Rangers and D-backs went from above the line in 2013 to below when including 2014. 

Once again, the A's are the "Moneyball" winner, but the enormous lead over the Cardinals shrunk. The Angels had the best record in MLB this year, and passed the Twins. Despite, the Orioles, Royals, and Pirates' improvements in 2014, they still need a few more good seasons to get back to league average. The expected win percentage is based on the baseball CPI figure from the right (it's also shown in the graph). There are 15 seasons documented. 


Saturday, September 20, 2014

Comparing Sunday, Monday and Thursday Night Football

Update: Oct. 2. I included a distribution chart showing games aren't more lopsided on any day.


In the early season, Thursday Night Football games aren't close. These Thursday games take abuse in the sports media empire for pitting blowouts featuring bad teams. The argument is that Thursday Night Football games (NFLN/CBS) are inferior to counterparts Sunday Night Football (NBC) and Monday Night Football (ESPN). 

I decided to test the hypothesis in two ways. The first was to find out how close the games were on each network. The second was to figure out how strong each team was. To do this, I went back to 2006, when the new sports media deals took place, and compared scoring margins of games on each network.


(SNF games also include the first week's Thursday game featuring the Super Bowl champion. TNF does not include Thanksgiving games, but the night one is in the NBC umbrella.)

NFL games roughly end in with similar point margins, regardless of network. Close are defined as ones that end in a one-score game, while I defined blowouts as games that were decided by at least three touchdowns. The myth that TNF are blowouts has been busted.

The second test was determining how good the competing teams were. I used each team's ending season win percentage to encompass the entire season. I also determined how many games featured sub-.500 teams (again, end of season record). 


First off, a disclaimer. NBC has an inherent advantage against over competitors - it utilizes flex scheduling in the second half of the season. That means the network may swap an unfavorable game for a more exciting one. A game has been replaced 12 times since 2006. Additionally, NBC gets their choice of game in Week 17, which always has playoff implications. TNF and MNF cannot swap games. The "SNF no flex" makes NBC stand with its original selection, and does not include games flexed in.

It's clear that NBC features better teams than ESPN or CBS/NFL Network, even when factoring in flex. TNF games were more than twice as likely to feature a sub-.500 team than a SNF game. In terms of total duds (two sub-.500 teams) SNF wins again.

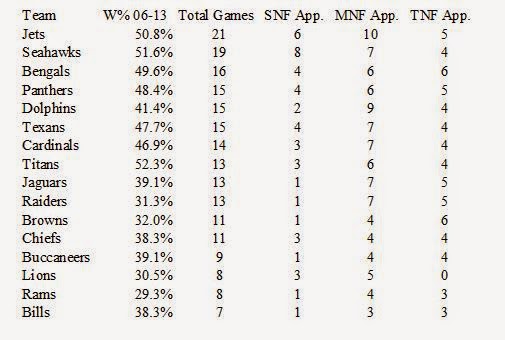
To figure out how SNF beats its competitors, I decided to look at which teams the networks are airing. Not surprisingly, "America's Team" led the way with 43 national TV selections (not including Thanksgiving) with 28 coming on NBC. 


SNF picks the popular and winning teams, while TNF and MNF give a fairer representation of the league. The Cowboys have aired on SNF as much as 13 NFL teams since 2006. MNF still favors the glamorous teams, but nowhere near the level of SNF. In a little more than half the amount of games that the other two have, TNF has a fairly even distribution.

To show how wide the distribution is, here's MNF vs. SNF:

SNF Mean: 9.06 appearances per team. Standard Deviation: 7.67
MNF Mean: 8.69 appearances per team. Standard Deviation: 3.26


Monday, September 8, 2014

Losing the first NFL game is like any other week, but 0-2 is panic time

Attention Packers, Saints, Bears, Patriots, Ravens, Colts and Cowboys fans it's not panic time yet. 

You're all 0-1. History shows us that plenty of 0-1 teams still make the postseason. Here are the numbers from the past decade. 

1-0 start: 53.75% reach postseason
0-1 start: 21.25%

It's not a surprise that 1-0 teams fare better than 0-1 counterparts given that it generally takes 10 wins to make the playoffs. Teams that go to the postseason (last five years) fared 31% better on average over the regular season than the teams that miss out. 

When we look at the first week's results, we're just singling out one piece to the puzzle. Looking at other weeks in the regular season yields similar results. I randomly picked a team's ninth game to explore. Results from past decade: 

Wins Ninth Game: 51.25% reach postseason
Loses Ninth Game: 23.42%

So the ninth game of the season means almost as much as the first game. The 2.5% difference is negligible. (There was also a tie in 2012, so the sample size is 318 teams for the ninth game). The bottom line is it hurts to lose any NFL game, regardless of the week. 

If a team begins the season on a losing streak, then it's officially time to panic. It should also be noted that it's not time to celebrate by starting the season strong. I ran the numbers from the same past decade (2004-2013), to include the second game. 

2-0 start: 61.90% reach postseason
1-1 start: 40.79%
0-2 start: 7.14%

Beyond the second week, only three teams have ever made the postseason starting 0-3, and none in the past decade. 

Those teams: Chargers in 1992, Lions in 1995, and Bills in 1998. Only those Chargers escaped from an 0-4 hole, although the Steelers (0-4 to 8-8) nearly pulled off the feat last year. And even the 2013 Steelers would have had one of the worst records to ever make the postseason.